
Moore Precision Cost has pioneered a revolutionary new method for Commercial and Industrial cost models that results in more accurate estimates of replacement cost new (RCN) by correcting flaws in existing models and tables offered by others. Moore has set out to not only bring you more cost table precision, but at a price point that provides big budget savings! Click the buttons below to discover what makes Moore Precision Cost the NEW leader in cost tables!
Cost estimating flaws that are corrected by Moore Precision Cost
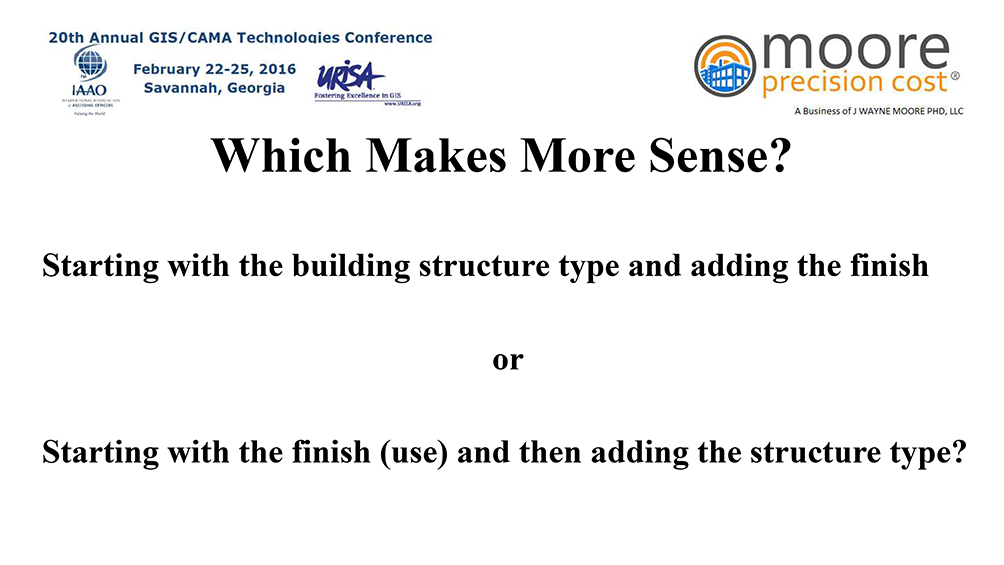
The cost estimating method currently used for commercial and industrial property is flawed. The current process begins with the question, “What is the use, occupancy, or purpose of the building?” The answer to this question directs the appraiser to a particular page or section of a cost reference that applies to the use such as retail, office, warehouse, etc. Once the appraiser reaches the correct use section, the next question to be answered is, “What is the structure framing type?” The cost source is then organized into four or five structure framing types, sometimes called construction classes, such as structural steel columns and beams, reinforced concrete, masonry load-bearing walls, and wood or steel stud load-bearing walls. Once the construction class selection is made, the appraiser must decide if the quality is excellent, good, average, or low cost based upon a very brief description of the exterior walls, interior finish, lighting, plumbing, mechanical, heating and air conditioning of what is typical for each quality level resulting in a single cost rate per square foot of building area, which is further adjusted by a multiplier from a table of estimated mathematical relationships between floor area and perimeter wall length. This process begins with the wrong question.
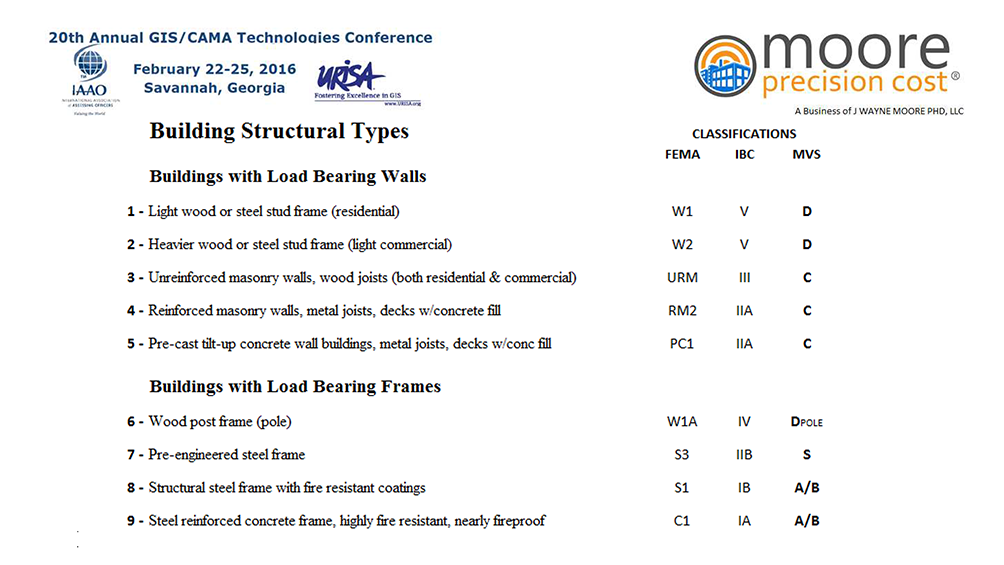
The second major flaw involves the cost issue associated with only having four or five building structure type classifications, which originated with the combustibility ratings of building materials rather than structural characteristics, strength, durability, material costs, and building technology. This causes too many actual building structure types to be lumped together with a resulting cost averaging that is incorrect for each type.
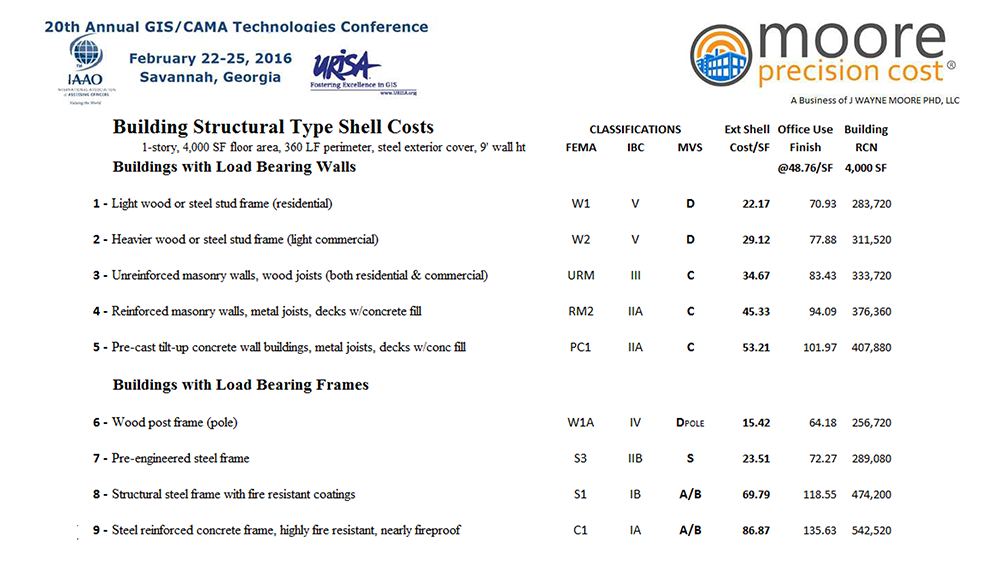
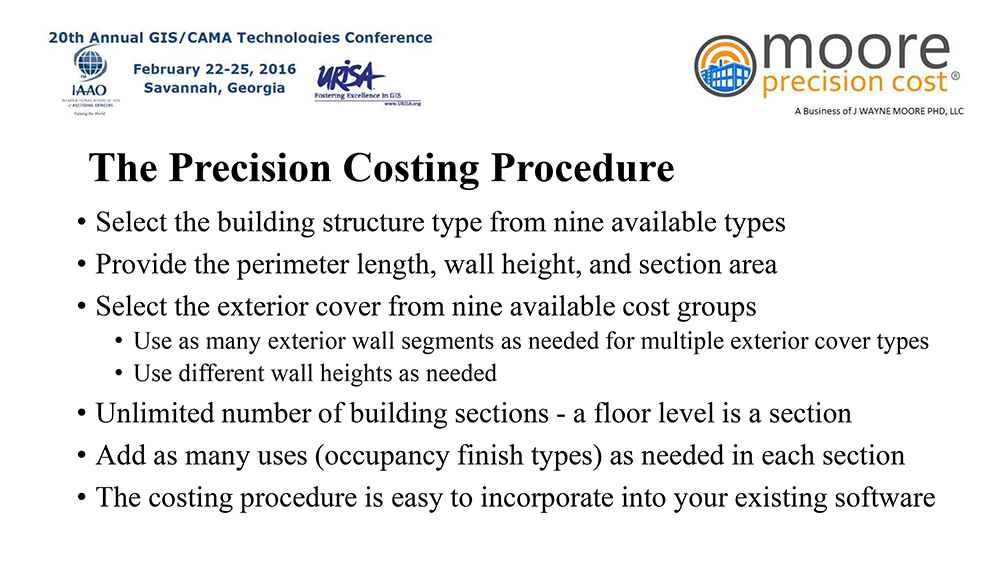
The new Moore Precision Cost method begins with the question, “What is the building structure type classification?”, which is used along with the exterior wall material type, wall height, and perimeter wall length to calculate the exact cost of the building’s exterior wall without the need for a multiplier from a perimeter-area relationship table. The building structure type classification and building area are then used to calculate the frame, floor, and roof cost estimates based upon what is typical for each of the building structure type classifications. The exterior wall, frame, floor, and roof cost estimates are then summed to obtain a building total exterior shell cost estimate, creating a finite number of major building cost categories based on building structure type classifications, independent of how the building is finished and used. The interior finish costs are developed according to the requirements of the intended use without regard to the building exterior shell structure. Many buildings contain a plurality of interior uses making a cost table organization based upon building use even less meaningful.
The new Moore Precision Cost method uses more building structure type classifications with nearly twice as many classifications providing a more precise definition of each classification and precision refinement of costs. For example, when various buildings that are classified as “masonry load-bearing walls” in the existing cost process are redefined into the new classifications contained in Moore Precision Cost, large differences are revealed between building shell structure costs with the refined building type classifications (see this illustrated with the example shown under the Cost Differences button).
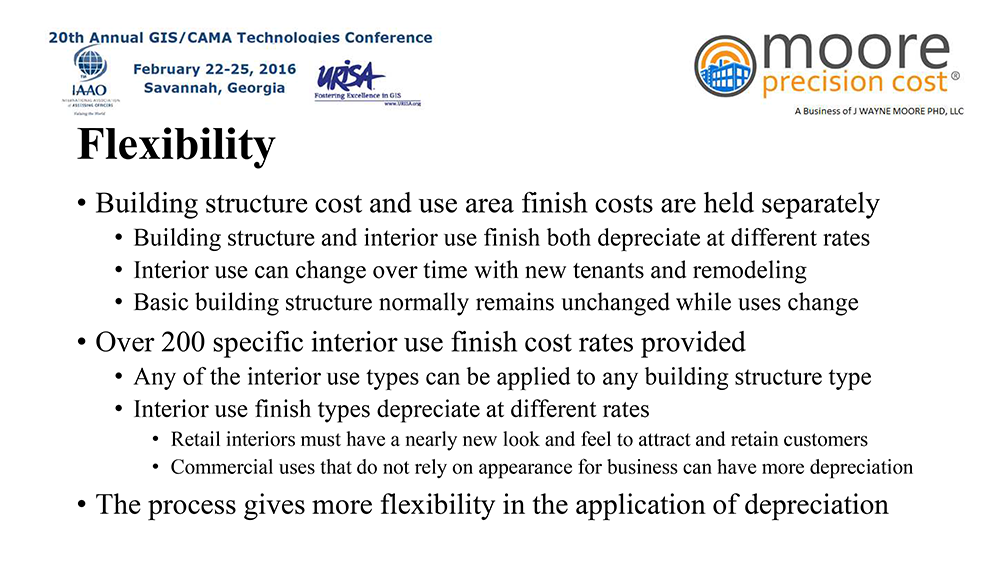
The new Moore Precision Cost method is a precision rapid costing process for estimating the replacement cost new (RCN) of an existing building, which is the estimated cost to construct a replacement building with the same utility as an existing or destroyed building. The method separates the exterior structural shell of the building from the interior finish, which is dependent upon the use of the building, and independently computes the estimated construction cost of each. The exterior structural shell of a building is rather permanent, is not easily modified, is a major portion of the cost of the entire building, and generally has a long life. Once the building exterior shell exists the interior can be finished to serve many different purposes or uses. For example, a 150,000 square foot masonry structure with 20 foot walls could be finished to serve as a warehouse, a big box retail store, or a health fitness facility. The exterior shell structure would be essentially the same irrespective of the use. The interior finish cost will depend upon the intended use and therefore is widely variable. The life expectancy of the interior finish components is much shorter compared to the life expectancy of the exterior shell of the building. The new Moore Precision Cost method allows the exterior structural shell and the interior use finish to be depreciated separately. In addition, the purpose and use of the building can be radically changed through complete redesign and refurbishment of the building’s interior without significant change of the exterior shell of the building.
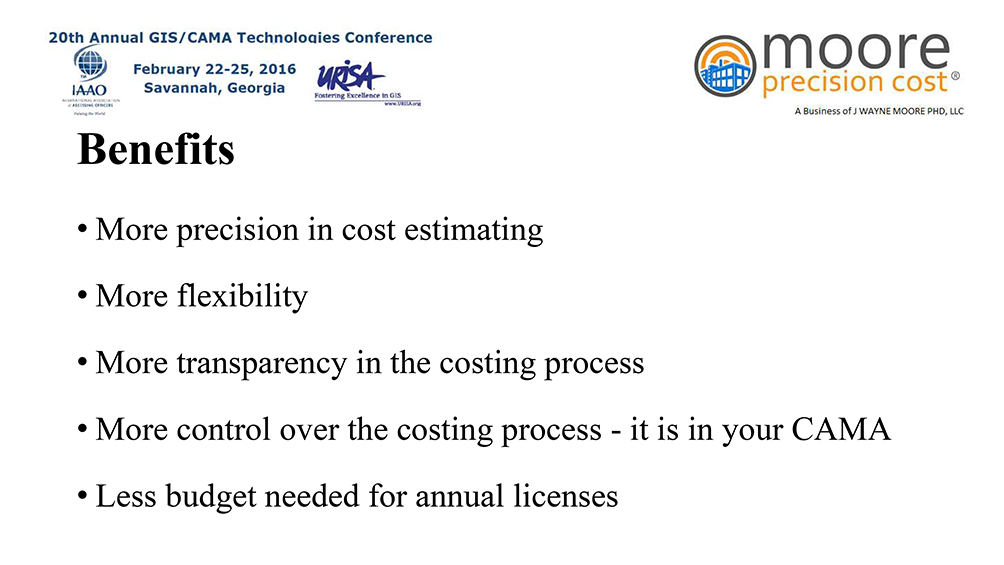
The new costing method for estimating the replacement cost new of an existing building corrects the long-standing flaws in the currently existing costing method and is more precise.
The new tables have been under development for the past six years, but the concept was first introduced over 20 years ago. The earliest cost table version was placed in use with CAMA software in 1996 and followed the recommendations contained in the 1995 IAAO Conference presentation “Market-Correlated Stratified Cost Approach” [View Here]
The IAAO presentation outlined weaknesses in the cost approach 20 years ago and suggested improvements. Please read the 1995 paper for background. Figures 5, 6, and 7 showed original ideas for a cost model and Figure 8 referenced hourly labor rate information from Craftsman Book Company. After negotiating the licensing agreement with Marshall & Swift in 1996 I incorporated their unit rates from Section B and Section C of the Residential Cost Handbook (RCH) into the model spreadsheet as illustrated in Figure 5, which became the ProVal cost engine. Please note that the ProVal cost model was never the same as the M&S cost model. For example, M&S sq. ft. rates are applied to the total living area of the home, i.e. the total of first floor and second floor areas added together, whereas the ProVal cost model separately computes first floor and second floor area costs using different sq. ft. rates and then adds them together for the total cost.
In 1996 end user licensing fees were established that were affordable to using jurisdictions, covered licensing costs with M&S, and would avoid the intellectual property and copyright violations that frequently occurred when users simply bought a copy of the M&S books and entered the costs into their computer systems, which could have resulted in embarrassing lawsuits. The original models evolved into using 9 house size price points from 600 to 3200 sq. ft. (Figure 5 of the paper had 7 house price points from 700 to 3600 sq. ft.), which have been used to generate the annual cost tables since then. However, even with the limitations of the original cost model, it performed 3% better as a pure cost engine than did Section A of the M&S RCH, using exactly the same house data (COD of 14.5 vs. 14.9). The same M&S data source was used in both calculations, but the difference resulted from the cost model itself. This was shown by the research reported in Table 2 of the 2006 IAAO Journal article, “Performance Comparison of Automated Valuating Models”. [View Here] The statistical results of the research experiment for a market-correlated stratified cost approach were reported in Table 2 as “TCM”. Twelve appraisal experts from across the country participated in that research. The new Moore Precision Cost residential tables have 25 house price points from 100 to 5000 sq. ft., instead of 9, with more detail and precision calculations than the original models, which contributes to considerably more accuracy of cost estimates in a CAMA environment.
If the end user license fees contained in the original M&S agreement had continued for the past 15 years with reasonable cost of living price increases, jurisdictions would be paying about half of the current annual rates. M&S was an independent company when the 1996 agreement was negotiated, but since then has passed through three new owners ending with its recent acquisition by CoreLogic, Inc. These management changes, combined with their near-monopoly market position, probably explains the current license fees.
J Wayne Moore PHD, LLC was selected to create models to update the 1999 Indiana cost schedules and translate the Craftsman unit-in-place costs for 2012 into the existing Indiana cost schedule format for residential, agricultural, commercial, and industrial real property in a manner that would not require the multiple Indiana software vendors to change their software programming so that they would only need to load the new 2012 tables into their database structures. The old cost model assumptions were found to be outdated. Research was done to modernize the residential cost models and this work laid the foundation for later research and development that resulted in the Moore Precision Cost residential models. Because of Indiana statutory limitations, the commercial models could not be modernized. The new tables were successfully used in all 92 Indiana counties, which had a total of about three million parcels. The new residential cost approach assumptions are explained in “Improving the Cost Approach Value Estimate with New Model Assumptions” [View Here], the feature article in the June 2012 issue of IAAO’s Fair & Equitable magazine. The 2010-2012 Indiana cost table research project laid the groundwork for further research and development. It also led to the establishment of a licensing relationship with Craftsman Book Company similar to the 1996 agreement with M&S, which provided a national construction industry unit-in-place cost data source for Moore Precision Cost.
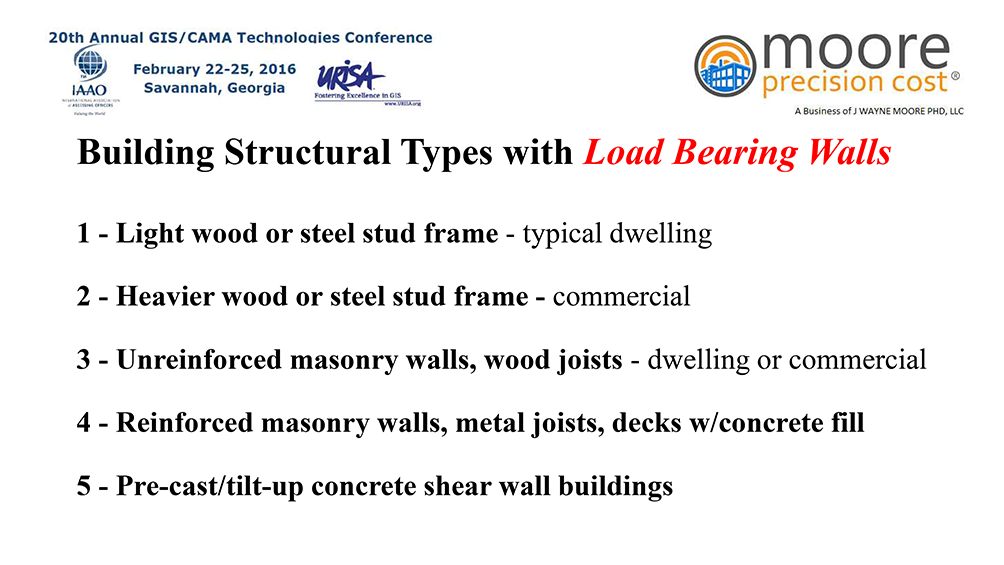
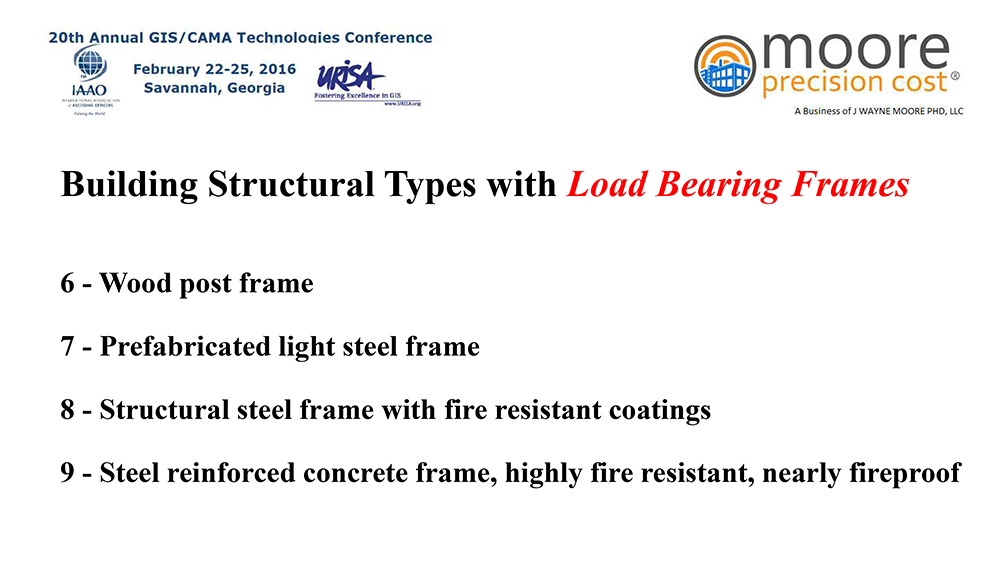
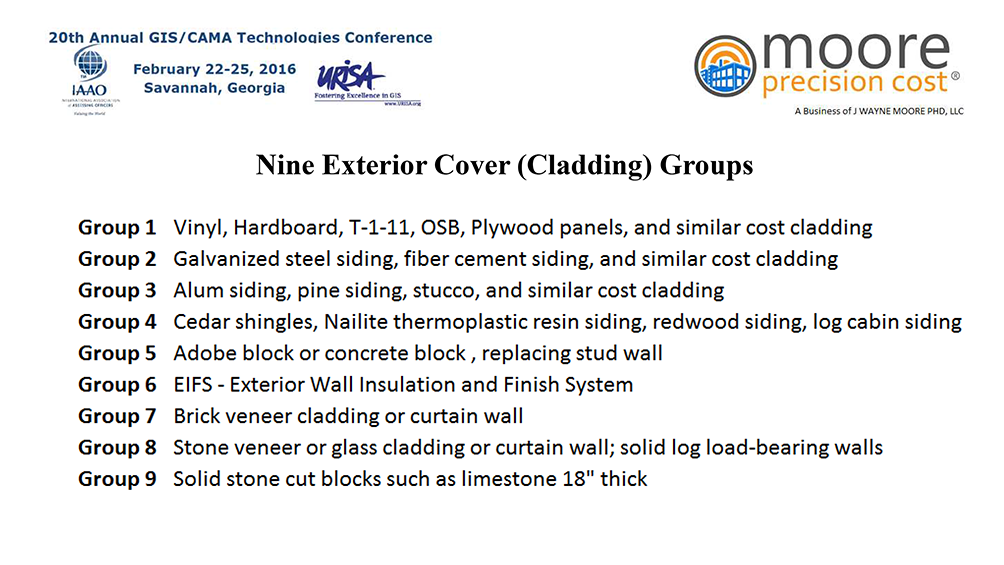
Research began in 2013 to find ways to improve the traditional cost approach used for commercial and industrial buildings, which had always been organized by combustibility classification and occupancy. This type of building type classification may work well for the insurance industry but leaves a lot to be desired for cost approach appraisal work because it does not adequately stratify the various modern types of building structures and begins with building occupancy/use instead of building structure. In 2013 complete building plan sets for all commercial and industrial new construction in the greater Indianapolis area and for the growing area just south of Indianapolis that had been built during the previous 10 years were obtained. The International Building Code (IBC) has been adopted throughout the United States as the core of local building codes. Hence, recent construction in any major metropolitan area can serve as typical for the entire country. These plan sets were studied in detail to learn the characteristics and features of modern commercial and industrial construction. From this research it became obvious that an improved cost approach would need to separate building shell structure costing from the building finish costing needed to satisfy the requirements of numerous uses or occupancies that might be placed in the same basic building structure, and that the finishes might change while the basic building structure would remain unchanged. The research also revealed that many different types of exterior cover or cladding are used with the same basic building structure resulting in considerable differences in cost. These cost differences have not been addressed well by the traditional cost approaches. The new Moore Precision Cost tables have nine building structure type classifications, nine exterior cover cost groupings, and over 200 use finish types that can be placed in any type of building structure. This significantly improves flexibility and precision in cost approach estimates.
A major advantage of using Moore Precision Cost tables is keeping the entire computational process under your control within your software. The tables are delivered annually in Excel® spreadsheets using a standard format. Guidelines and suggestions will be provided for use of the tables, but software developer still has complete control over how the calculations are done. The tables provide the capability for highly accurate RCN calculations. For example, with 25 stored price points in the residential table for base rates by size, interpolation can be used between the points to obtain a more precise estimated sq. ft. rate for the subject property. An example of the increased precision of Moore Precision Cost is in adjusting the sq. ft. rate for the type of exterior cladding, such as vinyl vs. brick veneer. Many cost systems use a flat rate per sq. ft. for the exterior cladding adjustment irrespective of floor size, whereas Moore Precision Cost is set up for adjustments using different rates for calculation according to floor size. At 400 SF the adjustment rate for brick is $16.45, at 800 SF it is $12.04, at 1200 SF it is $10.43, at 1600 it is $9.33, and at 2400 SF it is $9.10, which recognizes the relationship between exterior wall area and floor area. This example illustrates one of the many ways that Moore Precision Cost achieves more cost estimating precision for residential buildings.
Software changes will be needed to replace the M&S commercial black box if it is being used, or to replace your native commercial and industrial cost calculation procedures because the Moore Precision Cost calculation is new and unique. The calculation uses the same data typically collected for commercial and industrial properties including perimeter wall linear feet, floor area, wall type, wall height, and framing type. These characteristics are used in precise cost calculations for the building structural shell exterior wall, floor, and roof assemblies based upon nine different standard building structure types, producing the building structural shell cost that can have many different uses. The exterior wall can have an unlimited number of segments with differing wall heights and exterior cladding. The calculation process needed in the software is straightforward and easy to program. The complexity of the process is contained within the Moore Precision Cost model that generates the unit cost rates that are in the tables that the software uses for the computation.
As you transition to using Moore Precision Cost for commercial and industrial properties with its greater precision for these property types, you will need to work out an acceptable result display format because your software actually controls the display presentation, rather than being controlled by the tables that are used for doing the computations.
An actual 52,286 sq. ft. light manufacturing building completed south of Indianapolis in 2014 will be used to illustrate the cost computation. The building sketch is below in Figure 1. It has four different wall heights and interior use finishes for manufacturing and industrial office. The computational results are shown on the next page.

Figure 1. Actual light manufacturing building completed in 2014 south of Indianapolis
Industrial Building Description
Building structure type = 7 Pre-engineered steel frame
Total perimeter = 986 LF
Perimeter wall sections:
Uses (finish):
The computational results are shown below in Figure 2 with the building shell structure calculations on the left and the use finish calculations on the right.
| Building Shell Structure Calculation | Use Finish Calculations | |||
| First Floor Level – Section 1 (2014) | Primary Use Code | LMFG | ||
| Building Structure Type | 7 | Primary use area | 50,778 | |
| Total floor perimeter | 986 | Use area cost per SF | 25.36 | |
| Total floor sq. ft. area | 52,286 | Use area cost | 1,287,730 | |
| 1st perimeter wall section length | 666 | Primary Use other cost | 14,990 | |
| 1st perimeter wall section height | 28 | Use flat costs [FIRST FLOOR ONLY] | 4,300 | |
| 1st perimeter wall code | Steel | Primary Use area cost | 1,307,020 | |
| WH rate | 91.62 | |||
| 1st perimeter wall section cost – 666 LF | 61,020 | Second Use Code | INDOFF | |
| 2nd perimeter wall section length | 110 | Second use area | 1,508 | |
| 2nd perimeter wall section height | 15 | Use area cost per SF | 41.91 | |
| 2nd perimeter wall code | Steel | Second Use area cost | 63,200 | |
| WH rate | 65.36 | |||
| 2nd perimeter wall section cost – 110LF | 7,190 | 3rd use, 4th use, etc. | ||
| 3rd perimeter wall section length | 100 | |||
| 3rd perimeter wall section height | 12 | Total cost of all interior use finish areas | 1,370,220 | |
| 3rd perimeter wall code | Steel | |||
| WH rate | 59.30 | |||
| 3rd perimeter wall section cost – 100LF | 5,930 | |||
| 4th perimeter wall section length | 110 | |||
| 4th perimeter wall section height | 9 | |||
| 4th perimeter wall code | Steel | |||
| WH rate | 53.24 | |||
| 4th perimeter wall section cost – 110LF | 5,860 | |||
| 5th, etc. perimeter wall sections | ||||
| (total of wall sections = floor perimeter) | ||||
| Building Structure Type | 7 | |||
| Horizontal costs | 372,800 | |||
| Frame cost | 486,260 | |||
| First floor section 1 building shell cost | 939,060 | TOTAL Building First Floor Section 1 Cost | 2,309,280 |
Figure 2. Actual light manufacturing building cost calculations
This example illustrates the cost approach results that your software should obtain using Moore Precision Cost tables. The software should store the computational results in appropriate detail to allow depreciation to be applied separately to the building structural shell and the defined use areas for each building section and floor, keeping in mind that you should allow for an unlimited number of building sections, perimeter wall segments with different wall heights and cladding in each section, and an unlimited number of defined use areas in each section.
The base depreciation tables are included with the Moore Precision Cost tables. These depreciation tables are generic and intended as a starting point. As is always recommended, depreciation tables need to be reviewed, analyzed, and adjusted according to the needs of each assessing jurisdiction. The methods used for RCN calculation in the new cost tables for commercial and industrial buildings allows the vendor software to store the computed results separately for the building shell structure as well as the multiple interior use finishes within the building. This allows for separate depreciation schedules to be applied to the building shell structure as well as the multiple interior use finishes if the vendor has this capability in the software. This also allows interior use finish depreciation to be revised when use areas are renovated or completely replaced with new uses.
The Moore Precision Cost tables have everything necessary to handle the yard items, special features, and outbuildings.
All evidence from recent research has indicated that the published location modifiers from Craftsman, Marshall & Swift, and R.S. Means are of little value in fine tuning the final cost estimate. Additionally, the cost estimates from all three national publishers were discovered to be consistently higher than the actual local construction costs, at least in the central portion of the United States. This was discussed in the 2012 Fair & Equitable article. This problem must be resolved within each local jurisdiction by performing an analysis to compare cost schedule computed results with actual known new construction costs in the specific jurisdiction. The required analysis is simple and produces an adjustment factor called the verified economic modifier (VEM), which is explained briefly in the same attached F&E article. For these reasons location modification multipliers are not included with the Moore Precision Cost tables.


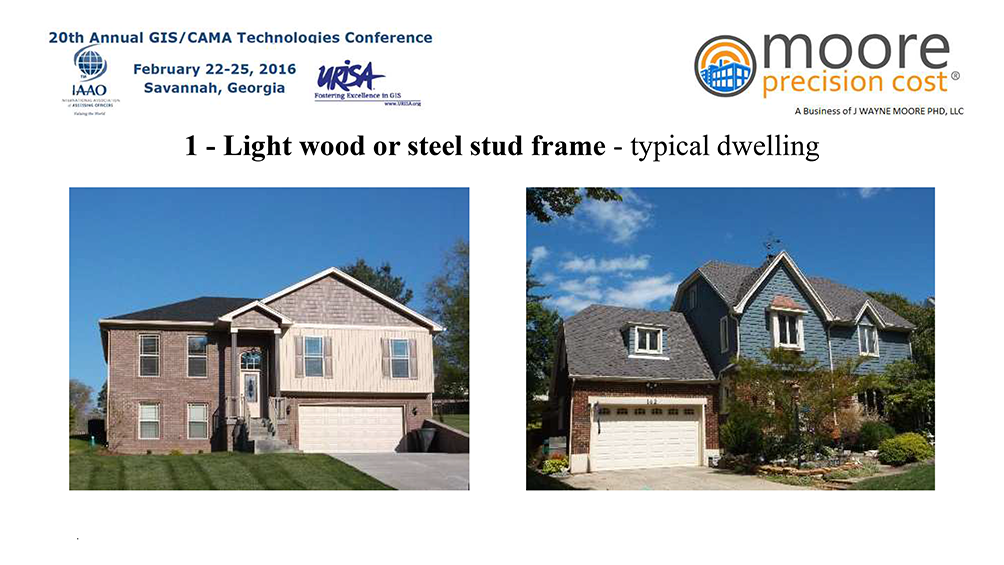
 These buildings are single or multiple family dwellings of one to three stories in height. Building loads are light and the framing spans are short. Floor and roof framing consists of wood joists or rafters on wood studs spaced 16 inches apart. The first floor framing is supported directly on the foundation, or post and beam supports. The foundation consists of spread footings constructed with cast-in-place concrete or concrete masonry block. Lateral forces are resisted by wood frame diaphragms and shear walls. Floor and roof diaphragms consist of straight or diagonal lumber sheathing, tongue and groove planks, oriented strand board, or plywood. Shear walls consist of exterior plywood or oriented strand board sheathing with a wide variety of exterior cover materials such as vinyl, wood, hardboard, fiberboard, metal, stucco, including masonry veneers such as brick and various types of stone. Interior partitions are sheathed with gypsum board.

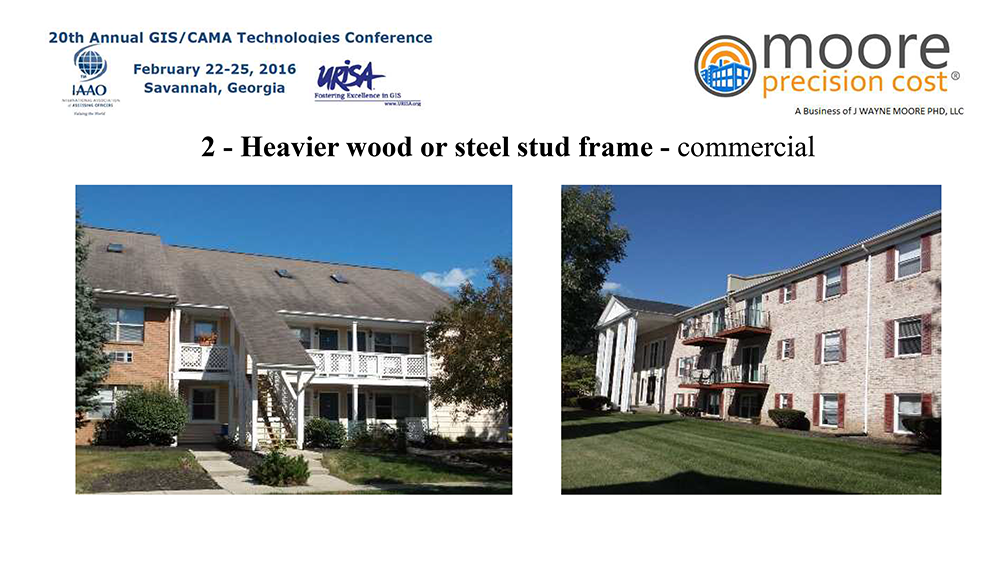
 These buildings are usually commercial or industrial with larger floor areas. There are few, if any, interior load bearing walls. The floor and roof framing consists of wood or steel trusses, glulam or steel beams, and wood posts or steel columns. Lateral forces are resisted by wood diaphragms and exterior stud walls sheathed with plywood, oriented strand board, stucco, plaster, straight or diagonal wood sheathing, or braced with rod bracing. Wall openings for storefronts and garages, when present, are framed by post-and-beam framing.

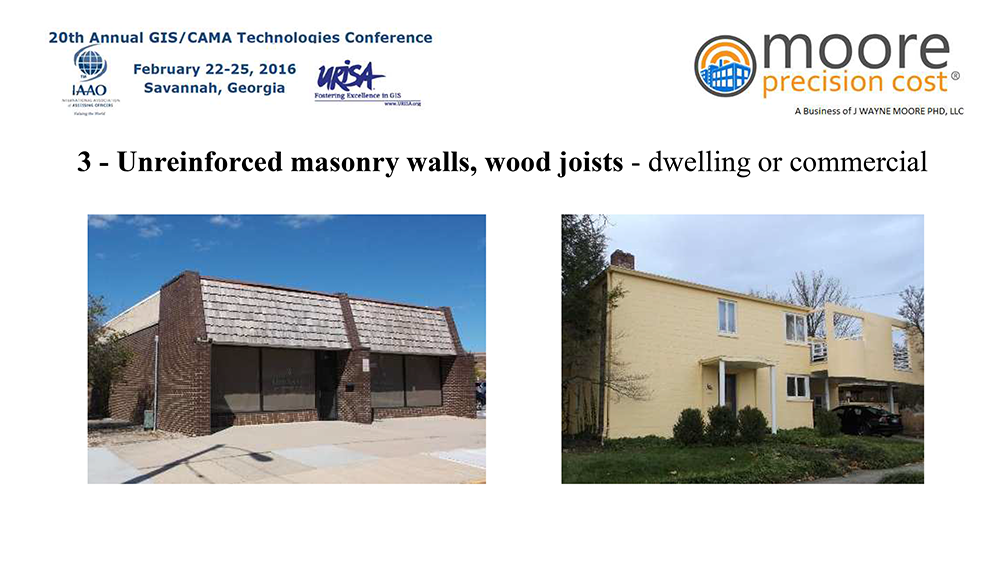
 These buildings have perimeter bearing walls that consist of unreinforced masonry, frequently concrete block. Interior bearing walls, when present, also consist of unreinforced masonry. Floors consist of structural panel or plywood sheathing rather than lumber sheathing. The diaphragms are flexible relative to the walls. When they exist, ties between the walls and diaphragms consist of bent steel plates or anchors embedded in the mortar joints and attached to framing. Foundations consist of concrete-spread footings.

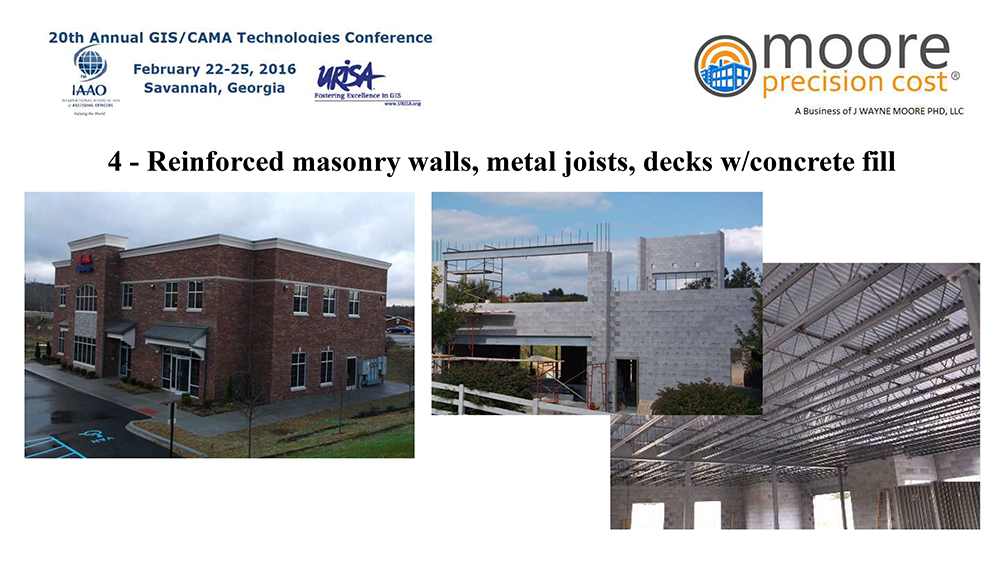
 These building have reinforced masonry load bearing walls and floors that consist of metal deck with concrete fill, precast concrete planks, tees, or double-tees, with or without a cast-in-place concrete topping slab, and are stiff relative to the walls. The floor and roof framing is supported on interior steel or concrete frames or interior reinforced masonry walls.

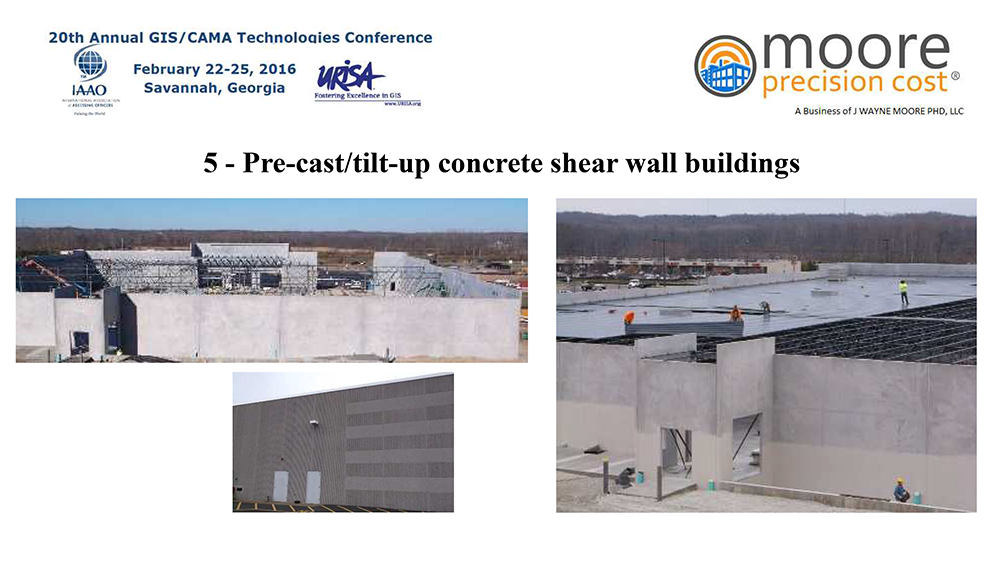
 These buildings are one or more stories in height and have precast concrete perimeter wall panels that are cast on site and tilted into place. Floor and roof framing consists of precast elements, cast-in-place concrete, or metal deck with concrete fill, and are stiff relative to the walls. Framing is supported on interior steel columns and perimeter concrete bearing walls. Lateral forces are resisted by the precast concrete perimeter wall panels. Wall panels may be solid, or have large window and door openings which cause the panels to behave more as frames than as shear walls. Foundations consist of concrete-spread footings or deep pile foundations.

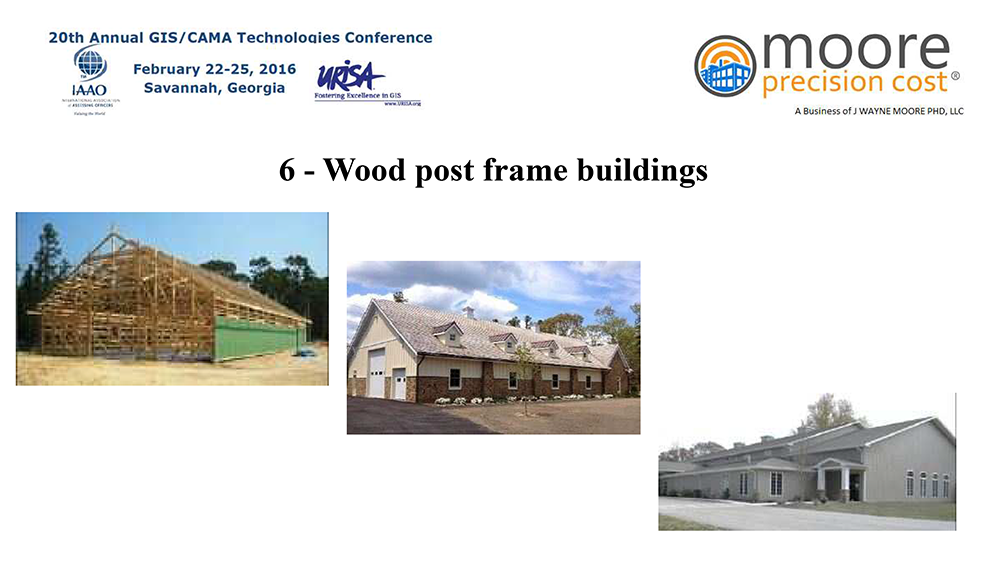
 These buildings feature large, solid sawn posts or laminated columns instead of wood studs, steel framing, or concrete masonry. Post-frame construction is an engineered wood-frame building system that meets UBC and IBC standards. They transfer loads to the ground or surface-mounted to a concrete pier or masonry foundation, and may use plastic barrier systems for enhanced protection of wood and concrete posts or piers. Post-frame structures are more quickly erected than other kinds of buildings. Because the larger posts and the interlocking frame can handle greater loads than stud-wall construction, fewer structural materials are needed, which saves time and other costs. Also, because posts are spaced farther apart than studs, post-frame buildings feature an exceptionally large wall cavity and provide ample room for insulation, lowering heating and cooling costs through the life of the building. Almost any type of exterior façade may be installed on post-frame buildings, which can be designed to meet the highest standards for quality and aesthetics. Post-frame construction is an efficient and economical option for low-rise applications and is now the construction method of choice for any number of commercial, industrial, municipal, residential, religious, and agricultural projects.


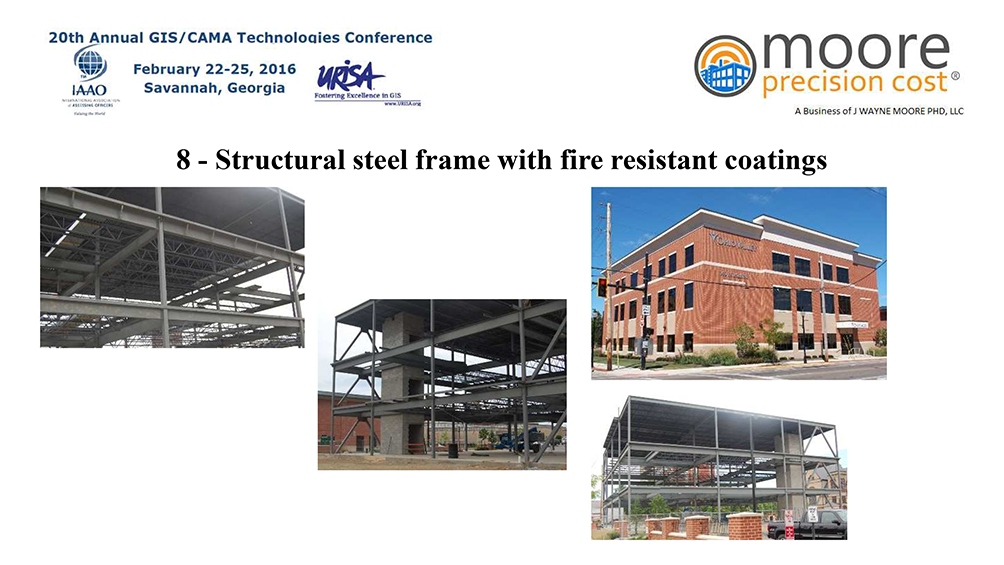
 These buildings consist of a frame assembly of steel beams and steel columns. Foundations consist of concrete-spread footings or deep pile foundations. Floor and roof framing consists of cast-in-place concrete slabs or metal deck with concrete fill supported on steel beams, open web joists, or steel trusses. Lateral forces are resisted by steel moment frames that develop their stiffness through rigid or semi-rigid beam-column connections. When all connections are moment-resisting connections, the entire frame participates in lateral force resistance. Diaphragms consist of concrete or metal deck with concrete fill and are stiff relative to the frames. A steel building’s structural members are expected to have fire resistance to prevent structural failure for a determined period of time to give the building occupants more time to escape and allow the fire service to control it. The required fire resistance periods for the different
  steel building types are found in local building codes. The structural steel needs to be protected against
  fire using the proper insulating materials and methods to protect the structural steel members and allow them to resist weakening for longer periods. Recent research has been conducted resulting in several fire-resistant steels with better strength levels developed. These steels represent a notable improvement over conventional steels in terms of elevated temperature yield strength. Exterior walls consist of metal panel curtain walls, glazing, brick masonry, or precast concrete panels. When the interior of the structure is finished, frames are concealed by ceilings, partition walls, and architectural column furring.

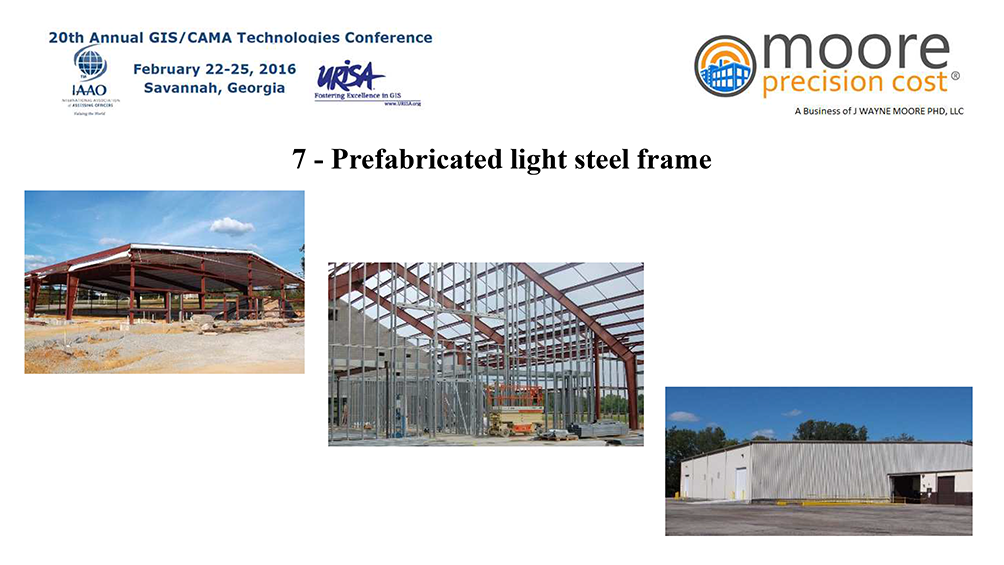
 These buildings are pre-engineered and prefabricated with transverse rigid steel frames. They are one story in height. The roof and walls consist of lightweight metal, fiberglass or similar panels. The frames are designed for maximum efficiency and the beams and columns consist of tapered, built-up sections with thin plates. The frames are built in segments and assembled in the field with bolted or welded joints. Lateral forces in the transverse direction are resisted by the rigid frames. Lateral forces in the longitudinal direction are resisted by wall panel shear elements or rod bracing. Diaphragm forces are resisted by untopped metal deck, roof panel shear elements, or a system of tension rod bracing.


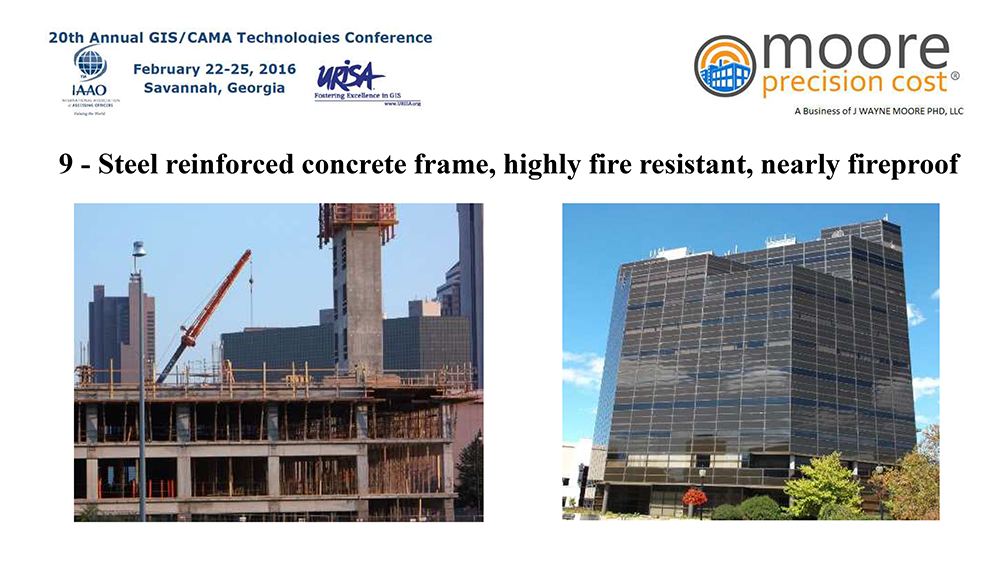
 These buildings consist of a frame assembly of cast-in-place concrete beams and columns. Floor and roof framing consists of cast-in-place concrete slabs, concrete beams, one-way joists, two-way waffle joists, or flat slabs. Lateral forces are resisted by concrete moment frames that develop their stiffness through monolithic beam-column connections. Modern frames in regions of high seismicity have joint reinforcing, closely spaced ties, and special detailing to provide ductile performance. This detailing is not present in older construction. Exterior walls consist of metal panel curtain walls, glazing, brick masonry, or precast concrete panels. Foundations consist of concrete-spread footings or deep pile foundations.